
Usage
Settings → Usage shows how much of your plan you’ve used this period. Pagr meters two things: pages (each rendered page counts) and AI tokens (consumed when the AI Assistant helps build templates). This page tracks both.
For the exact rules behind each, see How pages are counted and How AI tokens are counted.
Overview
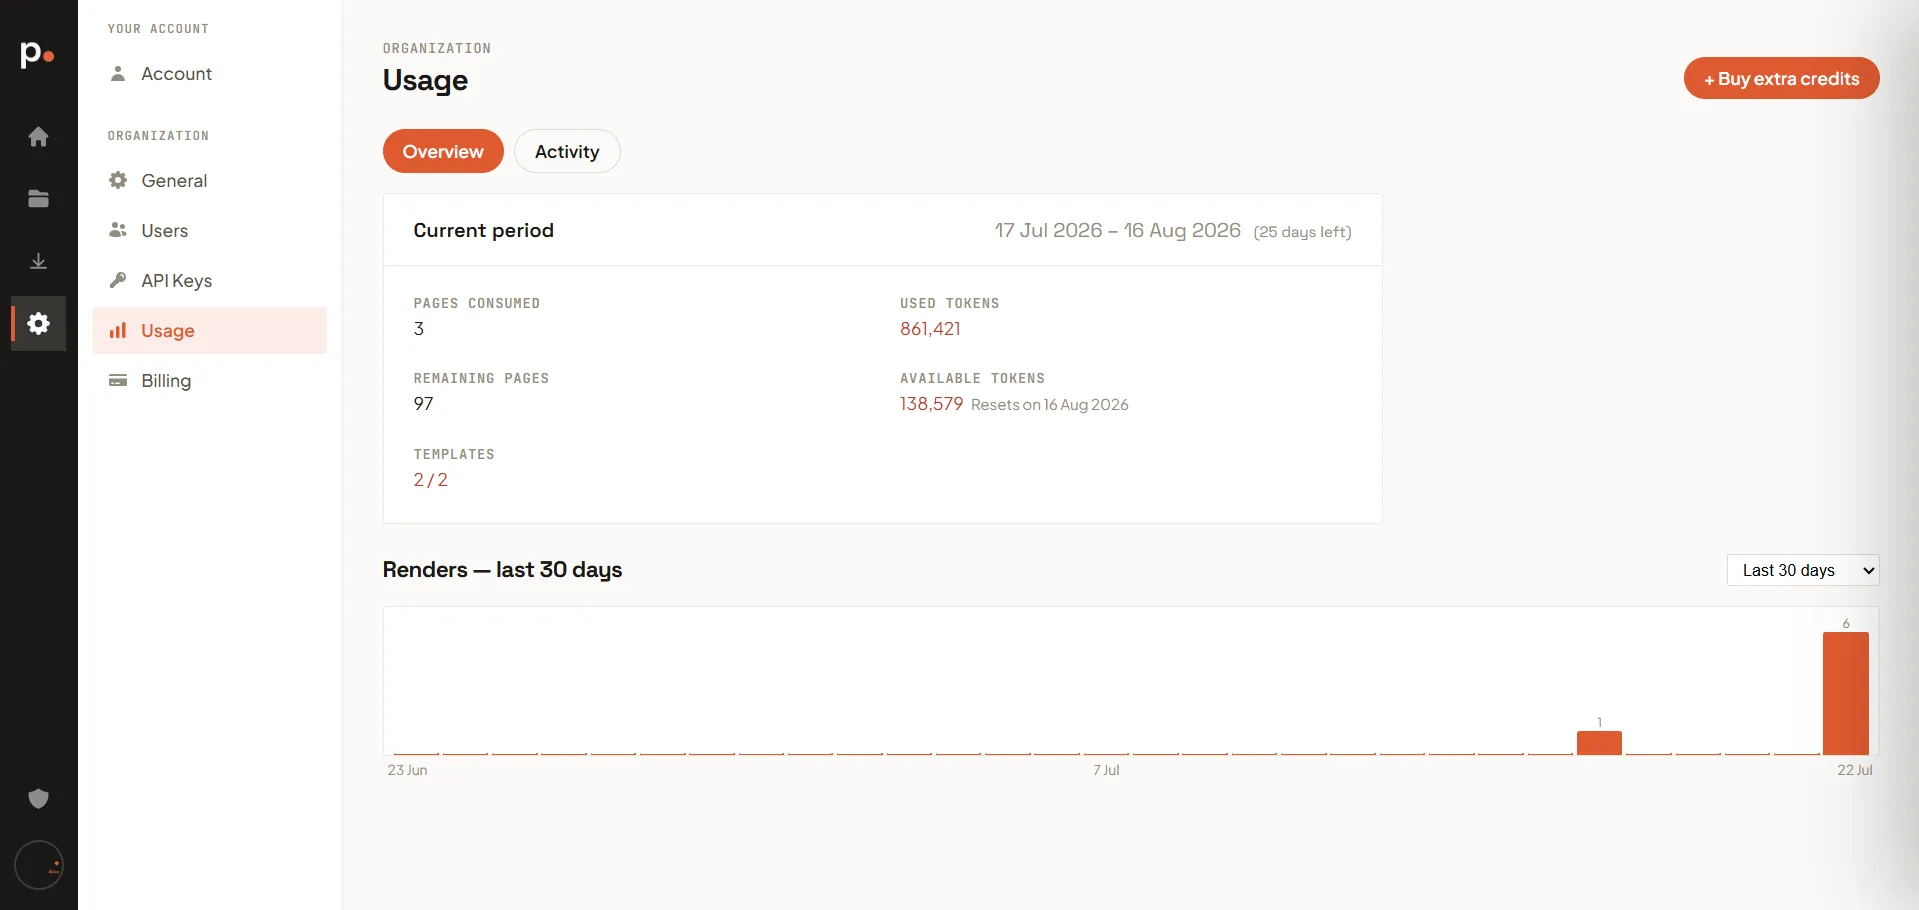
Section titled “Overview”The Current period card shows, for the current billing period:
- Pages consumed and Remaining pages
- Used tokens and Available tokens, with the date they reset
- Templates used against your plan’s limit
Below it, the Renders chart plots your renders over time, with a range selector (for example, the last 30 days).
If you’re running low, top up without changing plan: the Top up section at the bottom of this page offers preset amounts of pages and AI tokens, and + Buy extra credits at the top right opens a panel where you pick your own quantities. See Buy extra credits for the full walkthrough.
Activity
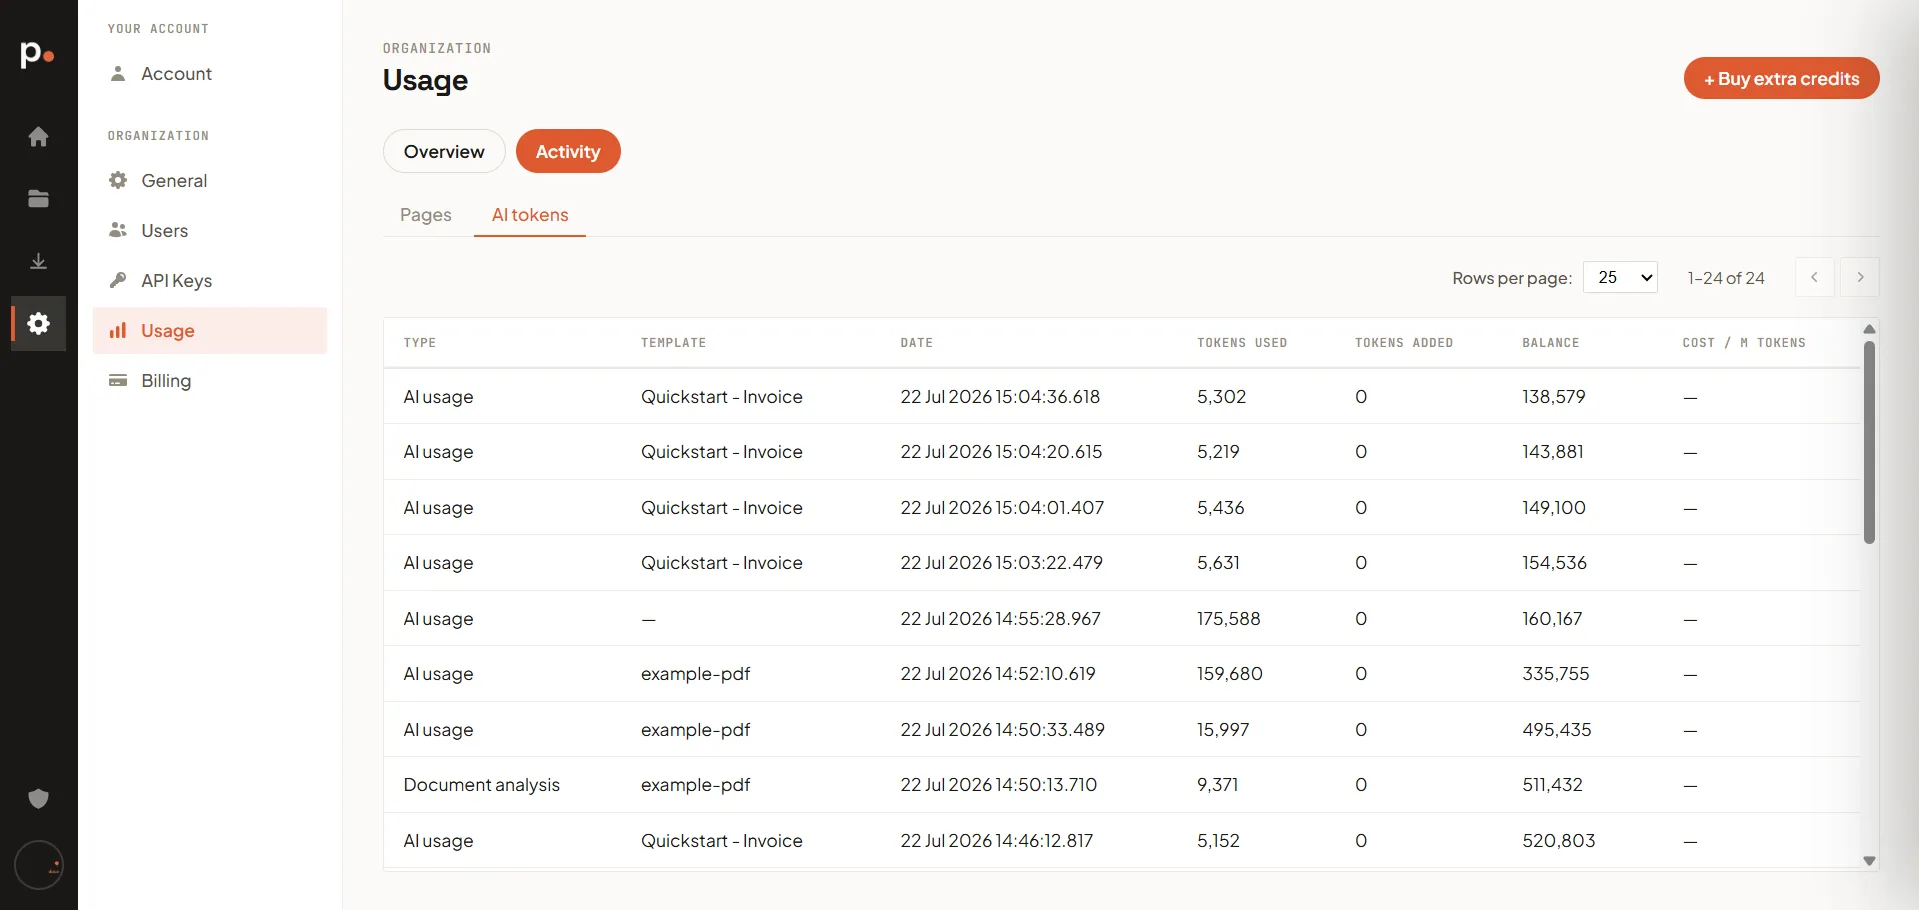
Section titled “Activity”The Activity tab is a detailed ledger, split into Pages and AI tokens sub-tabs. Each entry records the type of activity (for example, a Monthly fee that tops up your allowance, or a Render charge), the date, the template and document involved where relevant, how much was added or used, the running balance, and the cost per page. On the Pages tab you can open the related document straight from the ledger.
Related articles
Section titled “Related articles”- How pages are counted — what consumes a page credit and what doesn’t.
- How AI tokens are counted — what consumes tokens and why the cost varies.
- Buy extra credits — top up mid-period.
- Billing — your plan’s included limits and how to upgrade.
- Renders — the renders behind your page usage.
- Dashboard — a quick at-a-glance summary of remaining credits.